
About this report
Clean energy is growing rapidly, as annual deployment of a number of key technologies has surged ahead in recent years driven by policy support and continued cost declines. Their growth is starting to make a dent on emissions and reshape energy markets. This report aims to fill a gap by providing a timely, high-level overview of clean energy technology deployment for 2023 for a selected group of technologies. It is intended to be the first in a series, bringing together the most recent trends for a group of key clean energy technologies and assessing the implications for energy markets more broadly. It is not intended to be a comprehensive tracking exercise or to provide detailed analysis by technology.Introduction to the first edition of the Clean Energy Market Monitor
Clean energy is growing rapidly, as annual deployment of a number of key technologies has accelerated in recent years driven by policy support and continued cost declines. From 2019 to 2023, clean energy investment increased nearly 50%, reaching USD 1.8 trillion in 2023 and growing at around 10% per year across this period. The clean energy economy is a major industrial sector and an important contributor to the global economy. However, its benefits remain too concentrated with most of clean energy deployment occurring in China and advanced economies. The IEA regularly publishes comprehensive reports analysing recent progress in the development and deployment of clean energy technologies. These delve into the market dynamics, investment, innovation progress, manufacturing capacity, and deployment and cost evolutions of these technologies. The IEA also provides an annual assessment of technology progress using multiple indicators across a comprehensive suite of clean energy technologies and assesses this against the needs of the Net Zero Emissions by 2050 Scenario (NZE Scenario), as part of its Tracking Clean Energy Progress report. In the case of fossil fuels, market evolutions play out in real time in the form of prices, demand and supply balances, and inventories, with market participants able to access timely data and analysis. For example, the IEA tracks fossil fuel markets in a series of monthly, quarterly and annual reports, which review recent market evolutions and provide near-term and medium-term outlooks for demand, supply, trade and security of supply metrics. This new report, The Clean Energy Market Monitor, aims to fill a gap by providing a timely, concise and up-to-date overview of clean energy deployment for 2023 for a selected group of technologies. It is not intended to be a comprehensive tracking exercise or to provide detailed investment or technology trends. This is the first in a series, bringing together the most recent trends for selected key clean energy technologies and assessing the implications for energy markets more broadly. Given the acceleration of clean energy deployment since 2019, driven in part by Covid-19 recovery packages and the 2022 energy crisis, this first edition of the Clean Energy Market Monitor also analyses the energy market impacts of clean energy deployment trends since 2019.Executive summary
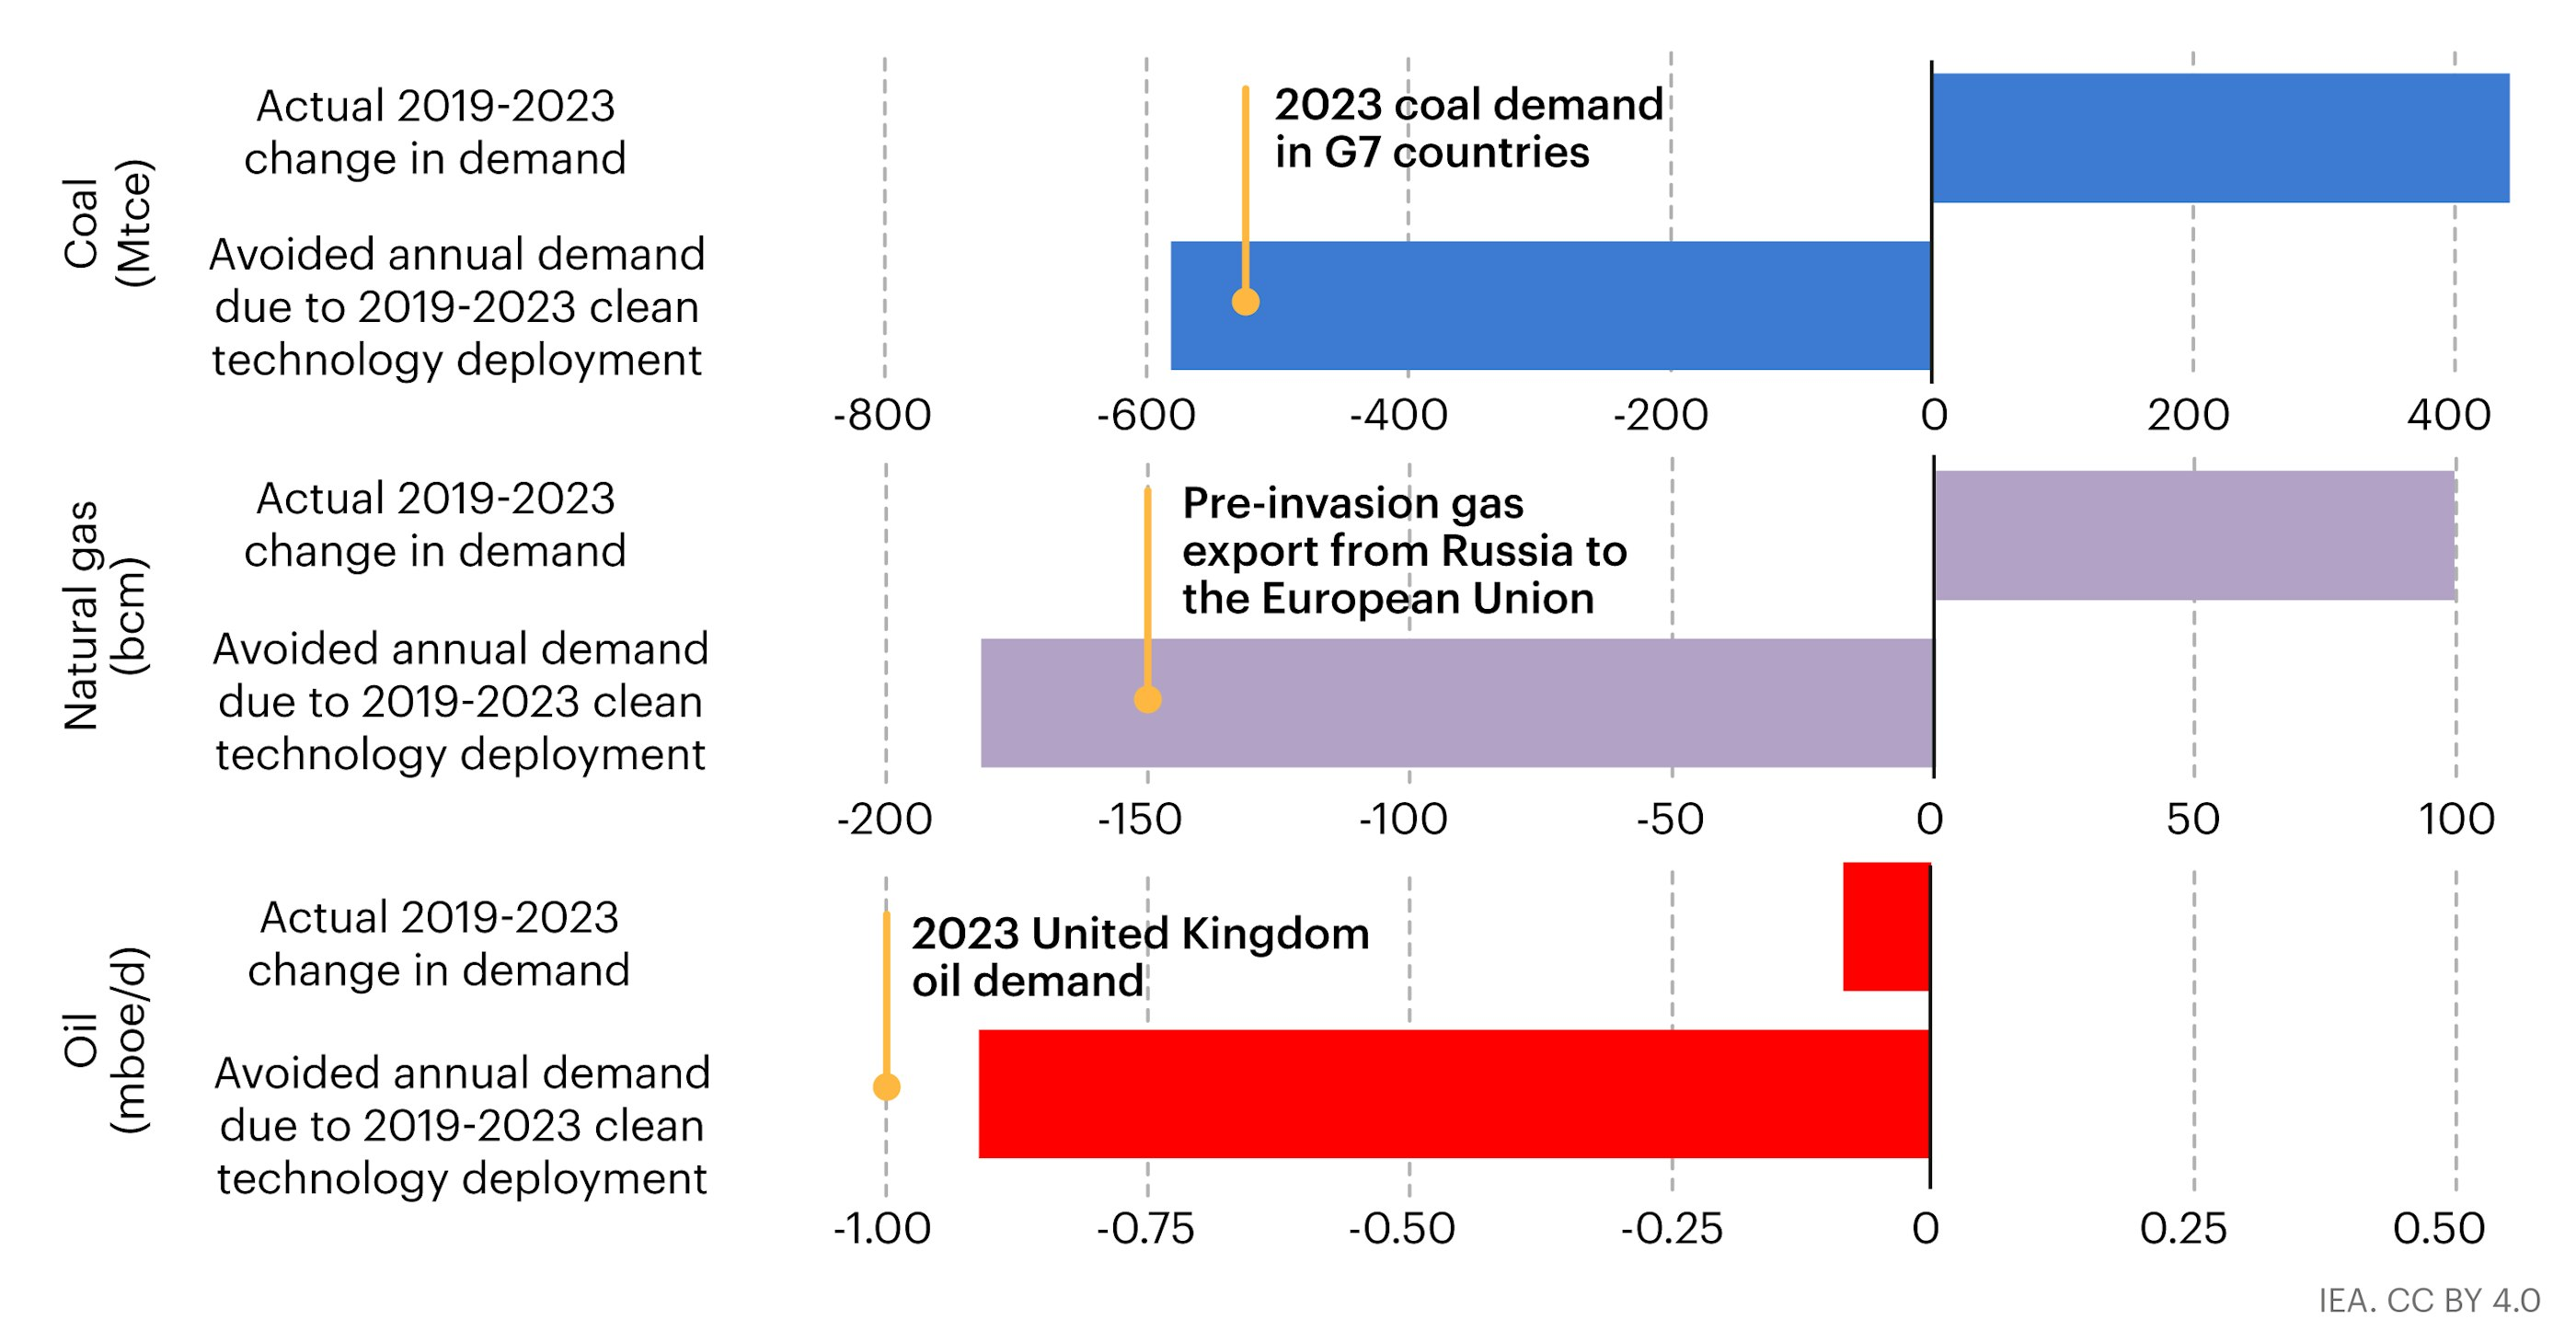
Global clean energy deployment scaled new heights in 2023, with annual additions of solar PV and wind growing 85% and 60% respectively. Capacity additions for these two technologies reached almost 540 GW, with China accounting for the majority of both. Clean energy deployment in 2023, however, remained too concentrated in advanced economies and China, with the rest of the world continuing to lag well behind. In 2023, China and advanced economies accounted for 90% of capacity additions for wind and solar PV, and more than 95% of global sales of electric cars. Electric car sales grew around 35% in 2023, reaching 14 million vehicles or one-in-five sales globally. China again led the way, with one-in-three cars sold being electric, while in the European Union it was one-in-four. By contrast, heat pump sales globally saw a marginal decline from the record levels of 2022, as squeezed consumers avoided spending on big ticket items and concerns around high gas prices eased somewhat. The slowdown of heat pump sales highlights the importance of supportive policies to help cash-strapped consumers and reduce the gap between electricity and gas prices. Nuclear capacity additions fell to 5.5 GW in 2023, although year-on-year variations in capacity additions are less meaningful for a technology with long project development and execution times. Construction of new nuclear reactors started on 5 projects in 2023. At the start of 2024, there were 58 reactors under construction worldwide - a total capacity of over 60 GW. Hydrogen electrolyser capacity additions grew by 360% in 2023, but from a very low base. This increase was due largely to China, as the European Union ceded its leading position. The United States also increased the speed of deployment, but annual additions remained modest in absolute terms. Energy efficiency is lagging behind, however. Our latest assessment shows an energy intensity improvement of around 1% in 2023, four times lower than the COP28 pledge to double the long-run rate of energy intensity improvement by 2030. On the back of Covid-19 stimulus packages, there has been a significant acceleration in clean energy deployment since 2019. From 2019 to 2023, clean energy growth outpaced growth in fossil fuels by a ratio of two-to-one. The production of low-emissions electricity grew by around 1 800 TWh, despite the stagnation of hydro power and decline of nuclear power due to drought and forced outages of the nuclear fleet in the European Union. Fossil fuel-based electricity generation grew by slightly less than 850 TWh. In end uses, the consumption of clean energy grew around two times more than fossil fuels. The deployment of five key clean energy technologies – solar PV, wind power, nuclear power, electric cars and heat pumps – from 2019 to 2023 avoids annual fossil fuel energy demand of around 25 EJ. This is equivalent to 5% of total global fossil fuel demand in all sectors in 2023, or almost the combined total energy demand of Japan and Korea from all sources last year. The coal demand avoided is around 580 million tonnes of coal equivalent (Mtce) annually. This is 30% higher than the actual increase in global annual coal demand of around 440 Mtce from 2019 to 2023. The largest driver of avoided coal demand was deployment of solar PV and wind power in electricity sectors around the world, with the two technologies avoiding around 320 and 235 Mtce of annual coal demand respectively. This is equal to the annual coal demand for electricity generation of India and Indonesia combined. Avoided demand for natural gas is around 180 bcm annually on an energy equivalent basis. This is nearly two times more than the actual increase in global annual natural gas demand of around 100 bcm from 2019 to 2023. The deployment of wind and solar PV provides the largest share of this avoided natural gas demand (155 bcm), although heat pump deployment also avoids around 15 bcm of annual demand and nuclear power also contributes. The avoided gas demand is more than the pre-invasion pipeline exports of natural gas from Russia to the European Union, which were around 150 bcm in 2021. Avoided demand for oil amounts to almost 1 mb/d in energy equivalent terms. Without this, oil demand would have risen above the pre-pandemic level instead of hovering still slightly below it in 2023 on an energy equivalent basis. Electric cars provided the majority of avoided oil demand.Actual change in demand and avoided annual demand due to technology deployment, 2019-2023


 2024-03-15